In times of economic uncertainty and mounting competitive pressure, it makes particular sense to take a careful look at existing production facilities before embarking on capital investments. Most manufacturers today have implemented continuous improvement processes to enhance plant performance. If the aim is to achieve significant cost reductions or a substantial increase in quantities, the limiting process steps and their interrelationships must first be assessed in a benefits analysis before developing measures to overcome the critical paths.
Dr. Claus Riehle, Dr. Hans-Joachim Leimkühler
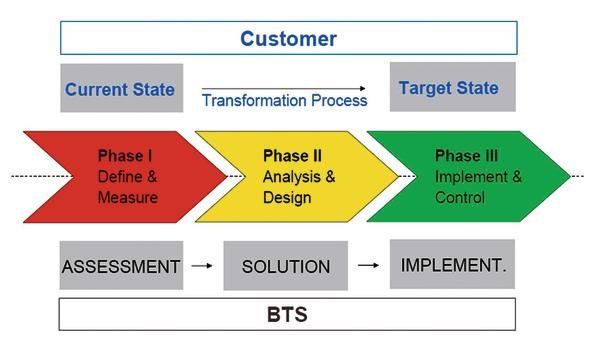
The BayOpX approach from BTS has proven itself in numerous projects as an excellent way to resolve such issues. The process is based on the Six Sigma cycle (DMAIC) and differentiates between three fundamental steps:
- Assessment (define & measure)
- Solution (analyse & design)
- Implementation (improve & control)
The BayOpX process is described below with reference to a production facility for fine chemicals. The customer initially instructed BTS to develop measures to increase capacity. This was followed by an assessment of the measures on the basis of criteria defined in cooperation with the operator. These results in turn served as a foundation for the decision. The BTS engi-neers also provided support during the final step – the implementation of the measures in production.
Assessment
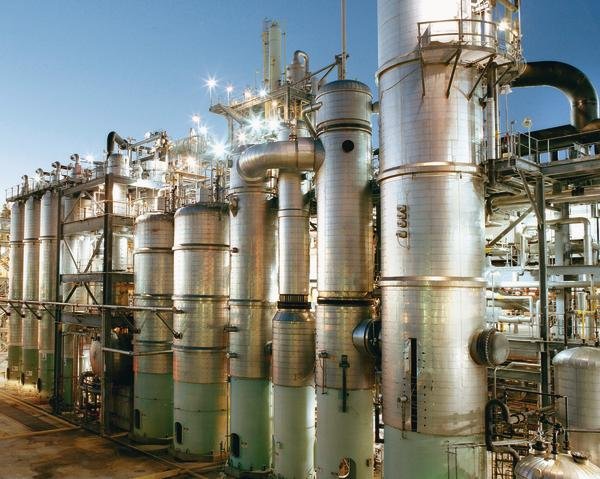
Assessment means identifying the fundamental steps in the production process and defining the task at hand, thus clearly establishing the project scope. The subject was an isomerisation plant in which a pure ortho isomer is produced from a feed mixture (28 % ortho and 72 % para isomer) in a two-stage fractionation process. It is a continuous plant in which only this one ortho isomer is produced.
The desired ortho isomer grade is achieved by sepa-rating the ortho isomer from the para ortho mixture at the head of the first column. This product stream is then purified in a second column, the purification column, to obtain ortho isomer according to the specification. A para-rich flow is passed from the bottom of the first column to a reactor, in which the reaction from para to ortho isomer takes place. The ortho-rich output from the reactor is fed into the first column together with the feed mixture.
The capacity at the start of the project was 15,000 t/a, the objective being to increase this capacity by 15 %. The customer imposed a special condition, specifying that the result of the project should ideally require zero capital investment and only minimal operating costs.
Solution
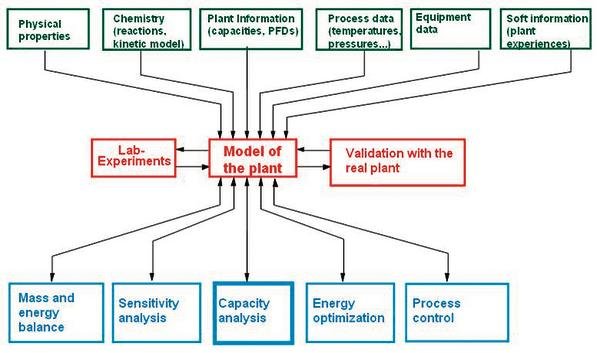
A precise description of the equipment and the process involved is required before bottlenecks in a complex production plant can be identified. The first step is therefore to compile existing data such as flow diagrams, operating parameters, process information, apparatus specifications and user experience. As in many other cases, the customer was able to provide up-to-date flow diagrams and had a process control system from which the operating parameters could be taken for analysis purposes. Drawings of the primary apparatus were also used for the assessments. However, a process information system for archiving historical data that would enable a quantitative analysis of the plant states was not available.
Material and energy flows were balanced to consolidate all information into a process model that served as the basis for further investigations. This model can be fed with additional information such as properties or kinetic data if necessary. The engineers working on this project were able to obtain the necessary pure component properties from the literature, while mixture properties such as phase equilibriums were estimated using proven thermodynamic models. During the course of the project, a decision was made to measure the kinetics of the para-to-ortho isomer reaction owing to the great significance of the isomerisation reaction. The measurements were performed in BTS’s test facilities. The experimental determination of the reaction kinetics is not a fundamental requirement for a project of this type, although the effect of the kinetics’ accuracy on the project results must be investigated.
Once all the necessary data was available, BTS created a preliminary version of the model in the form of a flow diagram with a mass flow bar and discussed it with the plant operators. This model can be continuously improved by iteratively repeating such discussions. The objective is to obtain a validated process model. Experience has shown that simply discussing it with users in the aforementioned form provides valuable information about the operation of the plant. In this specific instance, a comparison of operator observations with the mathematical process model revealed inaccurate or defective instruments and non-representative sampling. The reverse is also true: input from the operators can be used to adapt the process model to their observations.
A process model is considered to be validated when it is able to reproduce the current state of the plant with sufficient accuracy. The operator and the project manager decide jointly when this degree of model accuracy has been achieved. BTS then performs a sensitivity analysis on the basis of the validated process model to identify and quantify the primary variables affecting plant capacity from a network of influencing factors. Scenarios with completely different sets of operating parameters can be run with the aid of the process model. The project manager’s experience and expertise obviously play a decisive role in efficient project execution. Extensive apparatus knowledge and process know-how enables the project team to quickly determine which items of apparatus are potentially suitable for increasing capacity. Using the drawings and characteristic data, this apparatus can then be modified easily in the model and the effects of these changes calculated.
In this particular case, the process model and the analysis of the computed scenarios resulted in five promising measures for optimising plant capacity. The formulated package of measures must be assessed together with the customer. The plant operator in this example assigned low priority to those measures requiring capital investment (nos. 2 and 4 in the table) or resulting in reduced yield (no. 1). Of the remaining measures, increasing the recycle flow from the bottom of the isomer column to the isomerisation reactor appeared to offer the best prospects for achieving the targeted 15 % capacity increase.
The customer could also prioritise one of the other measures, depending on the variation of external parameters such as the prices for energy and raw materials. This clearly illustrates the great advantage of a process model, as it is a simple matter to vary the parameters and quantify the effects.
Implementation
Since the fifth measure promised a significantly greater capacity increase than the third (both at the cost of somewhat higher energy consumption), the operating mode with an increased recycle flow was chosen and optimised. This included a detailed check of the plant sections concerned under higher load. The isomerisation column with the vaporiser and condenser, the circulation pumps and the reactor with its peripherals were verified with the flows calculated by the model. The downstream plant sections such as the purification column were likewise analysed. No arguments against an increase in the recycle flow were found.
The next step was a field test. The BTS project manager joined the plant operators in the control room for this purpose to enable him to contribute his experience with modelling the new plant condition immediately if necessary. The recycle flow was increased in steps and the behaviour of the plant observed. As expected, the quantity of ortho isomer formed in the isomerisation reactor increased without any bottlenecks occurring in other locations. The model very accurately predicted the reality. The customer’s objective was achieved and the benefits were obvious. A continuous analysis over a period of several months revealed a lasting 18 % increase in plant capacity.
Other parameters such as energy demand and plant availability can also be investigated within the BayOpX process described above to provide the operator with further decision-making aids on the road to best practice and optimal plant utilisation.
Bayer Technology Services GmbH info@bayertechnology.com www.bayertechnology.com/
Share:


