Modern digital dosing pumps have set benchmarks in terms of precision and functional reliability. Industry continues to use conventional systems for dosing and process monitoring, however, despite the fact that they no longer satisfy the high demands placed on them. The digital Flow Monitor from Alldos allows users to control dosing behaviour precisely. The diagnostic system detects errors in the dosing head and reports malfunctions reliably and without delay even at the lowest dose rate settings in the ml/h range.
Prof. Helmut Voss, Sergej Gerz, M. Ayatollahzadeh
There are a wide range of highly sophisticated dosing tasks in process engineering which place high demands on dosing pumps in terms of precision, reliability and, in particular, dosing process monitoring. Dosing antiscalants and antifouling agents in reverse osmosis processes and in the growth sector of diaphragm filtration are instances of typical, complex applications. Further critical examples include dosing various biocides and defoaming agents in paper production and dosing cleaning agents and disinfectants for CIP applications. Reliable dosing of concentrated acids and lyes has proved to be a difficult task in the detoxification and neutralisation processes of industrial process and waste water treatment.
Conventional solutions
Up until now, the most commonly used solutions for dosing monitoring in the case of diaphragm dosing pumps have operated according to the floater principle. This method involves moving a float upwards in a pipe during the pressure stroke. The float falls again during the suction stroke of the pump. This movement of the float is recorded visually, magnetically or inductively. Depending on the manufacturer, adaptation to the dosing rate of the pump is achieved by moving the switch and/or adding a bypass. This is precisely where the weaknesses in this system lie. These settings have to be adapted to the relevant operating conditions of the pump and when the stroke length and/or frequency are changed. This method of dosing monitoring is often unsuitable if there are large variations in stroke frequency or when dosing viscous liquids. The most common causes of faults when dosing with dia-phragm pumps are as follows:
- Air and/or gas bubbles in the dosing head
- Cavitation bubbles in the dosing head
- Leakage in the suction or pressure valve
- Inadmissibly high operating pressure or system pressure fluctuations
These operating states can be detected and evaluated using the indicator diagram for the dosing process as will be explained in greater detail below.
Indicator diagram
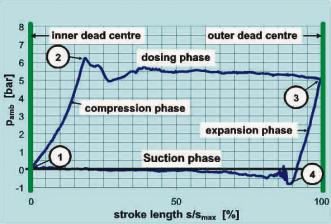
The indicator diagram displays the pres-sure profile across the suction and pressure strokes of the piston or diaphragm. Figure 2 shows the pressure profile of a diaphragm pump which is functioning correctly. Starting at point 1, the pressure stroke features a compression phase with a build-up of pressure up to the opening pressure of the pressure valve at point 2, and this phase is followed by the feed process into the pressure line until the outer dead centre (point 3) is reached. During the return stroke, there is a drop in pressure down to the suction pressure at point 4 with a subsequent suction process until the inner dead centre (point 1) is reached, i.e. the start of this cyclical process. When the indicator diagram described above has a properly functioning diaphragm pump as a reference stored in the microprocessor, even minor faults can be detected from the changes in the current indicator diagram.
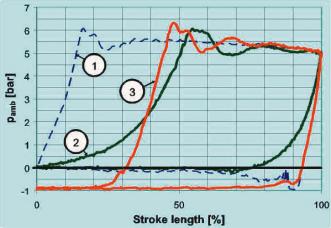
Figure 3 compares two frequently occurring faults in the dosing process with the error-free pressure profile (curve 1). If there are air and/or gas bubbles in the dosing chamber (curve 2), pressure builds up more slowly due to the much greater elasticity. This means that it takes longer to reach the system pressure and that the dosing volume of each stroke is significantly smaller. In the case of large errors on the suction side of the pump, extensive cavitation can occur as shown in Figure 3 (curve 3). The reasons for this can be overly small cross-sections, excessive levels of suction or excessive viscosity. Vapour pressure dominates the entire suction stroke and only dissipates late in the pressure stroke. This scenario also results in a smaller dosing volume per stroke due to the delay in reaching the system pres-sure.
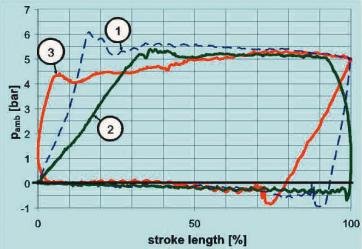
Figure 4 compares two further common faults in the dosing process with the error-free pressure profile (curve 1). If leakage occurs in the suction valve (curve 2), pressure builds up more slowly due to the leakage flow – there and the pressure falls before the outer dead centre is reached – as soon as the leakage rate is larger than the actual flow rate of the pump. If leakage occurs in the pressure valve (curve 3 in Figure 4), a rise in pressure occurs before the end of the suction stroke, namely when the leakage rate in the pressure valve is higher than the actual suction flow of the pump. Moreover, the pressure falls more slowly at the start of the suction stroke as a result of post-flow in the pressure valve.
This indicator diagram is also suitable for detecting other faults. If the set system pressure is exceeded, for example, this is identified and evaluated.
System solution
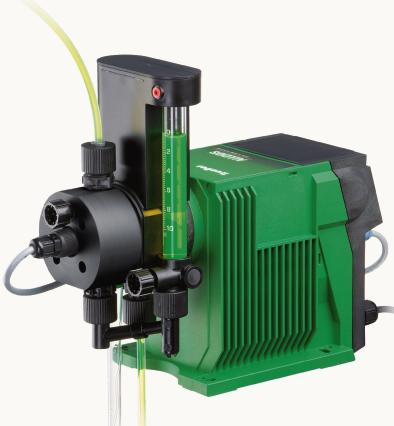
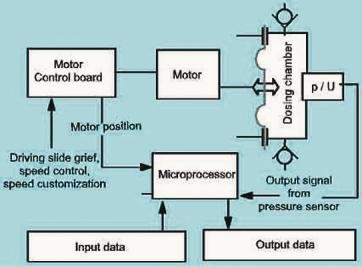
Alldos has produced a plug & play solution whose dosing pump also incorporates a pressure sensor. This solution uses the existing microprocessor for both motor control and processing the measurement values. As can be seen from Figure 5, the microprocessor continuously records the pressure in the dosing chamber and, with the help of the motor control, the motor position which can also be used to determine the diaphragm position on the basis of the drive kinematics. This means that the microprocessor can generate the indicator diagram continuously. Evaluation algorithms have been developed for this plug & play solution to enable detection and evaluation of the dosing errors described in greater detail above.
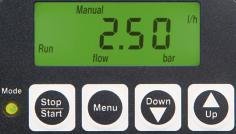
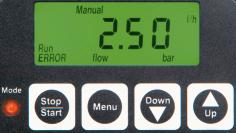
The basic parameter settings for monitoring volumetric flow have been selected to cover a wide range of standard applications. Depending on the error in question, a fall in the dosing rate of only 30 % can be reliably detected. Moreover, it is now possible to read out representative points on the indicator diagram from the memory and use them for the purpose of diagnosing errors. The processor also takes an average of the values to continuously calculate the feed pressure in the dosing chamber. This value is representative of the current system pressure and can be queried at any time at the press of a button.
Many opportunities
Continuous monitoring of diaphragm dosing pumps by recording and automatically evaluating the current indicator diagrams opens up many opportunities for operational monitoring.
- As a status parameter, the pressure enables a process to be established which is largely independent of the pump size.
- The indicator diagram is practically independent of speed, viscosity and temperature. This establishes the same system for detecting errors across the pump’s entire volumetric flow range – for example in the case of TrueDos 209–0,4D from 4 to 400 ml/h – without defining a working point.
- Recording the current system pressure enables users to effectively compensate pressure-dependent variations in the flow rate of the pump by adapting the speed.
There is still significant potential in terms of detecting and quantifying errors by expanding the quantity of data recorded and the microprocessor performance, by fine-tuning the evaluation algorithms and by drawing on other experiences with this process.
cpp ###
Manufacturer’s homepage
Impeller-Net
Pump engineering calculator
Share:


